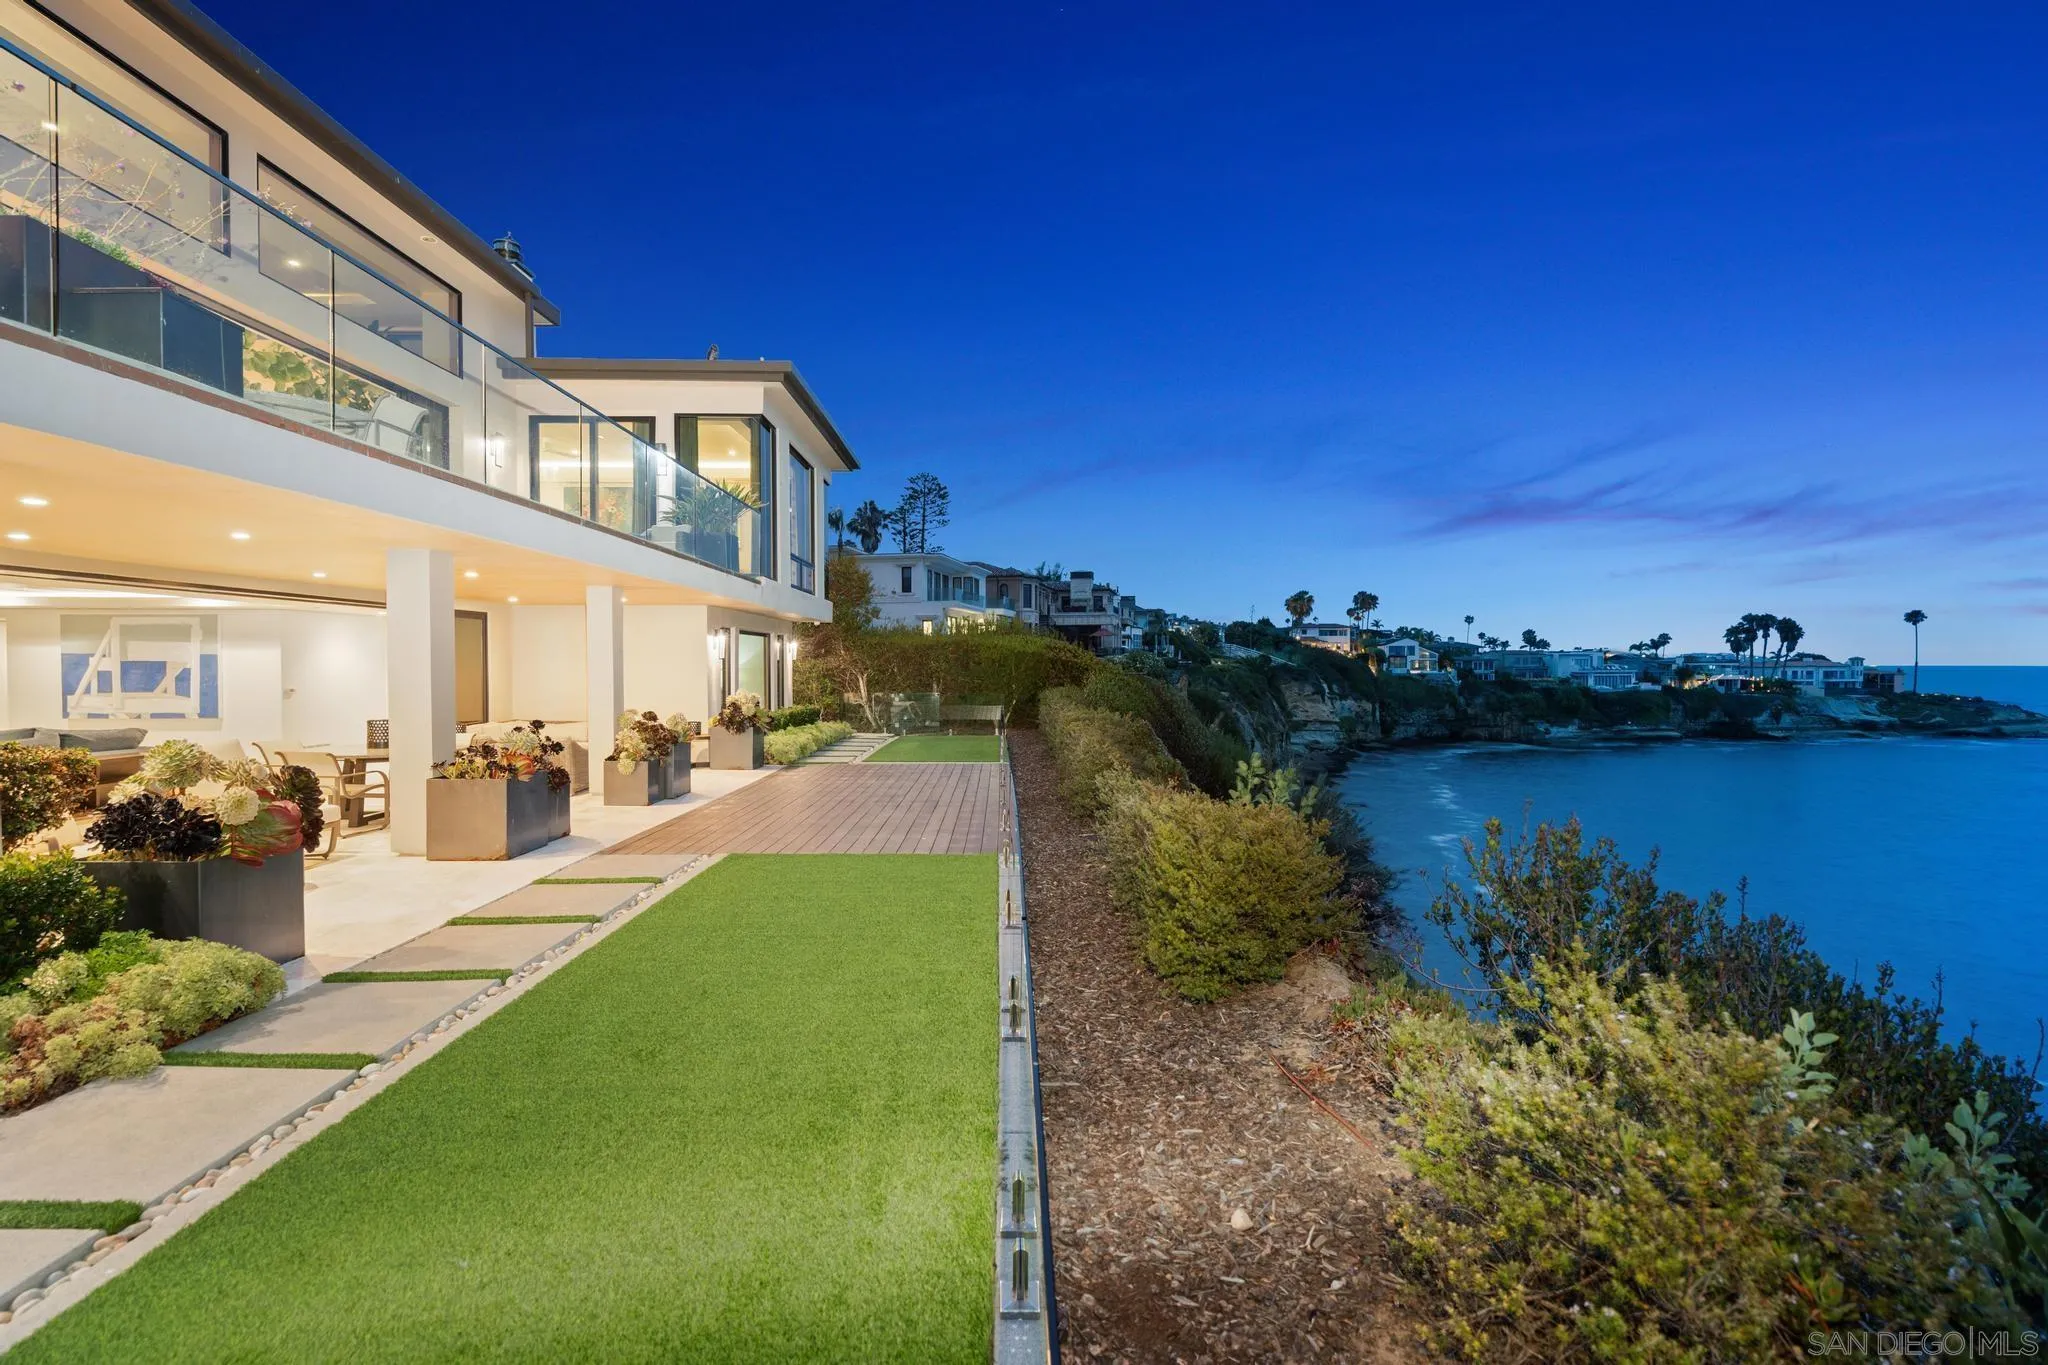
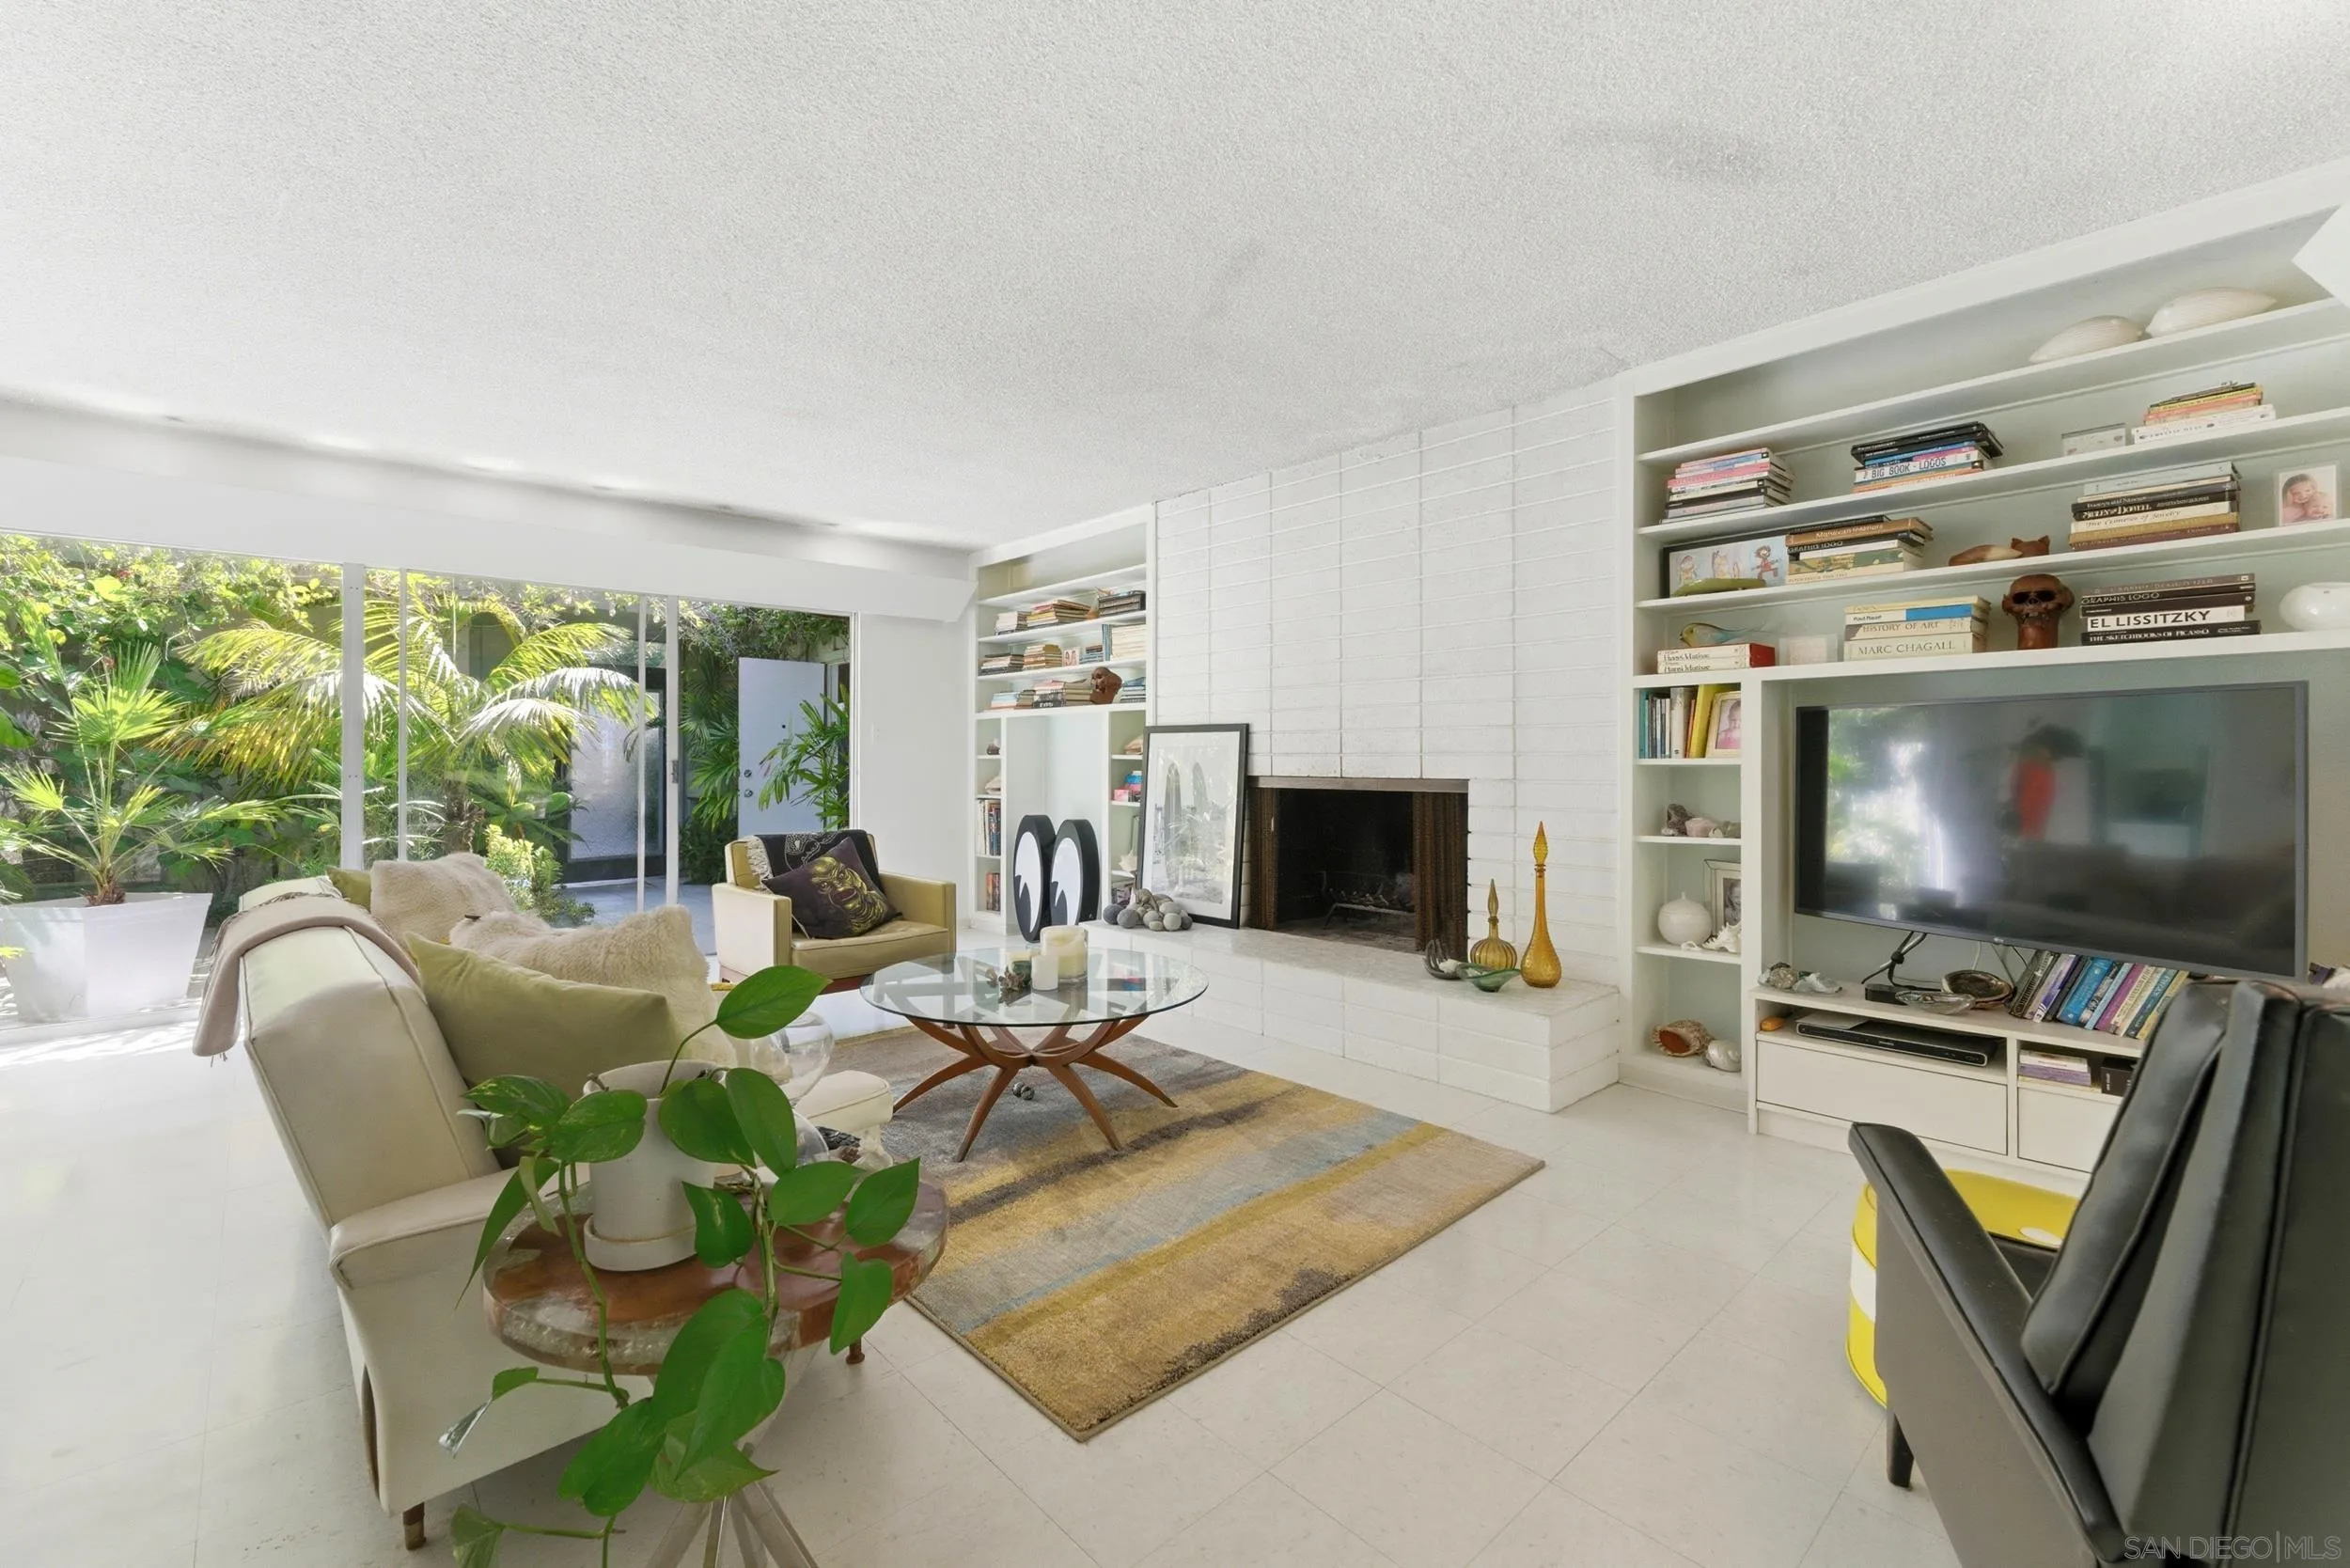
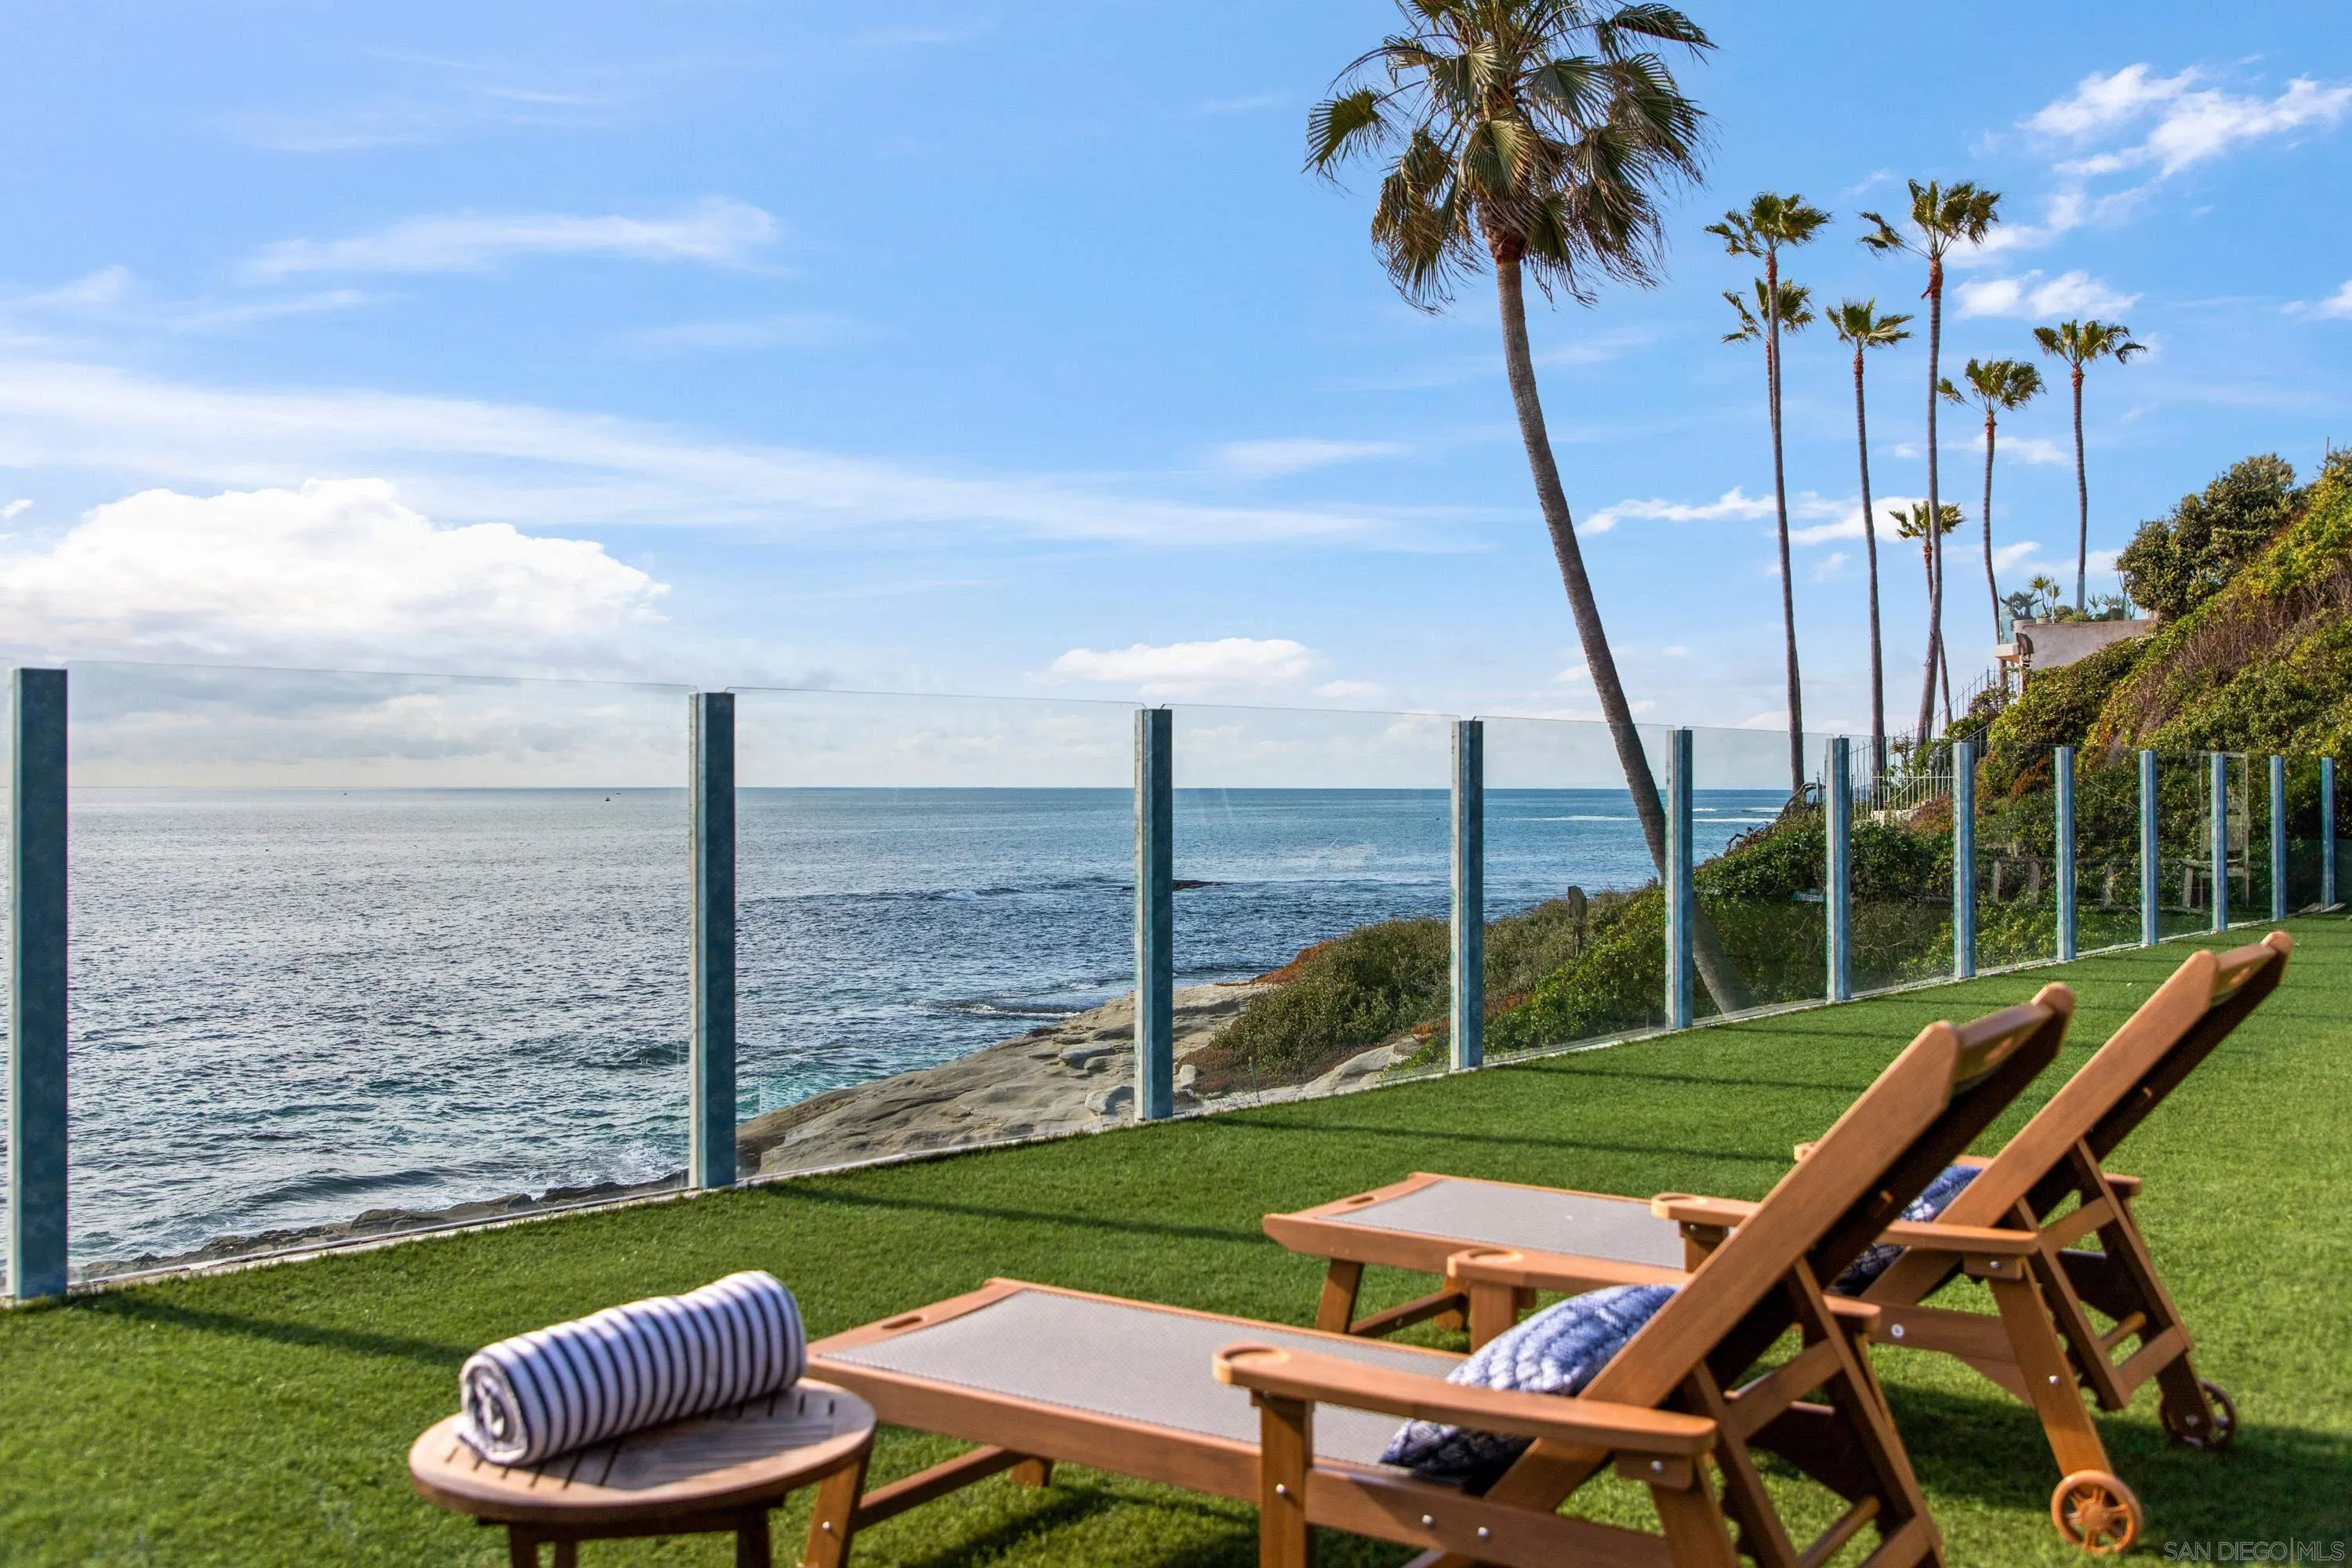
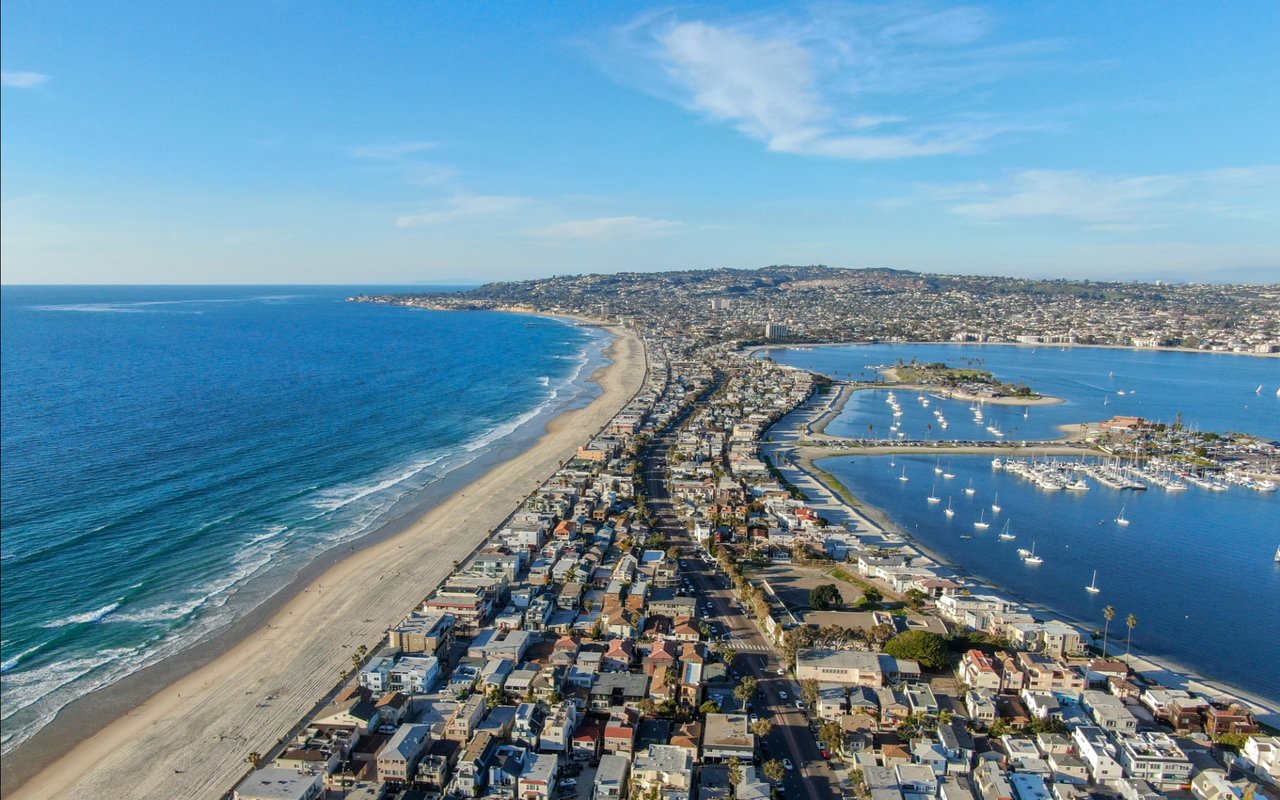
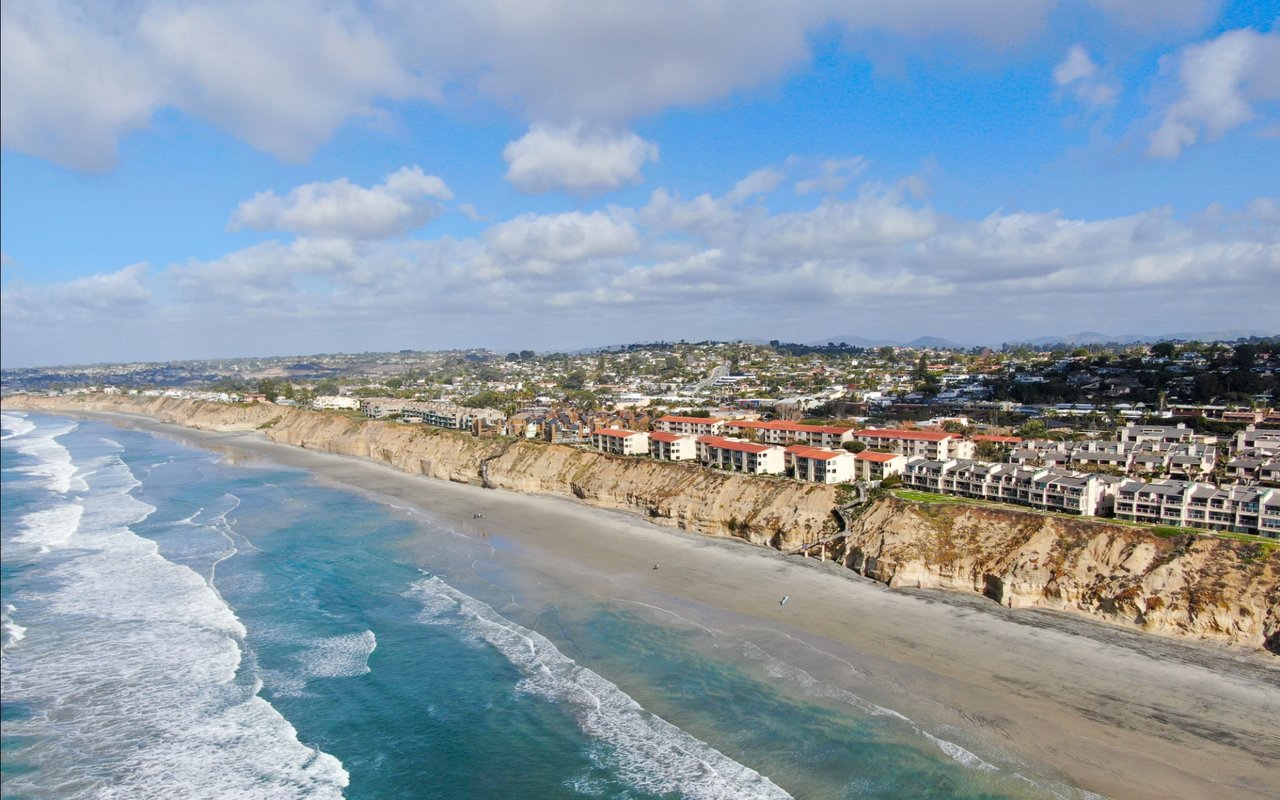
If you’re looking for classic La Jolla living, look no further than Lower Hermosa, where you’ll find eye-catching, beautiful, seaside estates. Most were built in the 1920s, and offer easy access to sandy shores that are a contrast from some of the area’s more expert surfing hot spots.
Although homes are older, they are beautifully maintained with owners taking pride in continuing the tradition that was established here by “Old La Jolla” residents.
689 people live in Lower Hermosa, where the median age is 57 and the average individual income is $112,768. Data provided by the U.S. Census Bureau.
Total Population
Median Age
Population Density Population Density This is the number of people per square mile in a neighborhood.
Average individual Income
There's plenty to do around Lower Hermosa, including shopping, dining, nightlife, parks, and more. Data provided by Walk Score and Yelp.
Explore popular things to do in the area, including Answered Fitness, Ribeiro Jiu-Jitsu La Jolla, and Kayak Joe SD.
| Name | Category | Distance | Reviews |
Ratings by
Yelp
|
|---|---|---|---|---|
| Active | 3.33 miles | 5 reviews | 5/5 stars | |
| Active | 1.16 miles | 5 reviews | 5/5 stars | |
| Active | 4.14 miles | 8 reviews | 5/5 stars | |
| Active | 0.66 miles | 8 reviews | 5/5 stars | |
| Beauty | 4.36 miles | 6 reviews | 5/5 stars | |
| Beauty | 1.12 miles | 21 reviews | 5/5 stars | |
| Beauty | 2.28 miles | 69 reviews | 5/5 stars | |
| Beauty | 0.8 miles | 10 reviews | 5/5 stars | |
| Beauty | 2.67 miles | 5 reviews | 5/5 stars | |
| Beauty | 2.95 miles | 7 reviews | 5/5 stars | |
| Beauty | 1.3 miles | 11 reviews | 5/5 stars | |
|
|
||||
|
|
||||
|
|
||||
|
|
||||
|
|
||||
|
|
Lower Hermosa has 255 households, with an average household size of 3. Data provided by the U.S. Census Bureau. Here’s what the people living in Lower Hermosa do for work — and how long it takes them to get there. Data provided by the U.S. Census Bureau. 689 people call Lower Hermosa home. The population density is 5,427.25 and the largest age group is Data provided by the U.S. Census Bureau.
Total Population
Population Density Population Density This is the number of people per square mile in a neighborhood.
Median Age
Men vs Women
Population by Age Group
0-9 Years
10-17 Years
18-24 Years
25-64 Years
65-74 Years
75+ Years
Education Level
Total Households
Average Household Size
Average individual Income
Households with Children
With Children:
Without Children:
Marital Status
Blue vs White Collar Workers
Blue Collar:
White Collar:
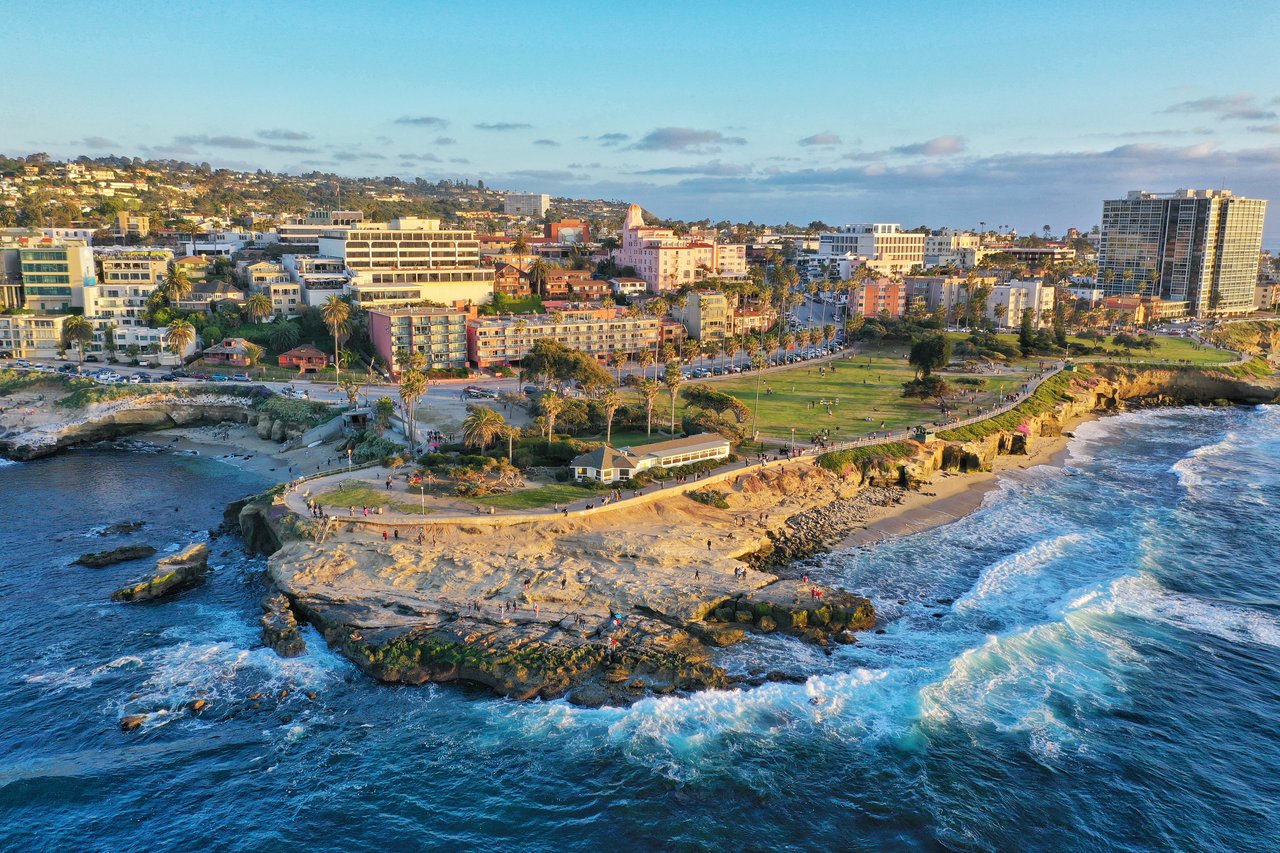
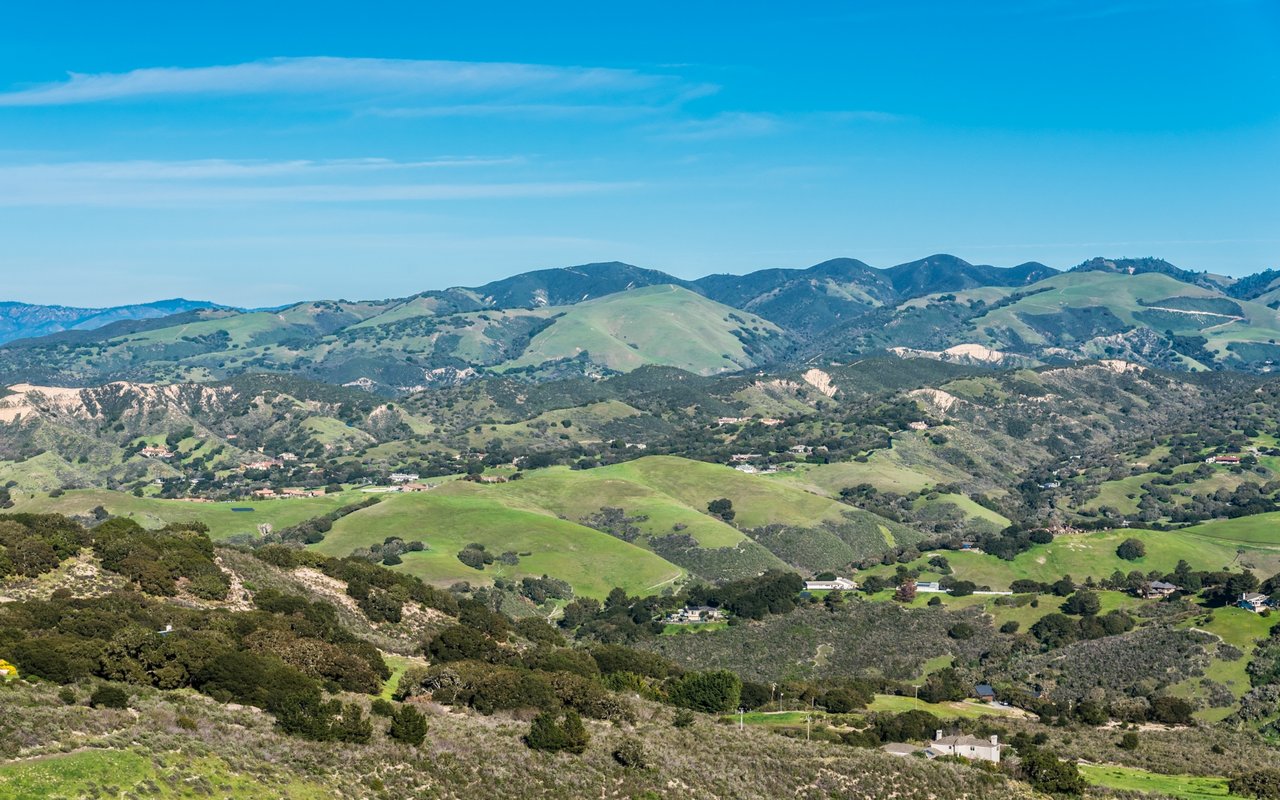
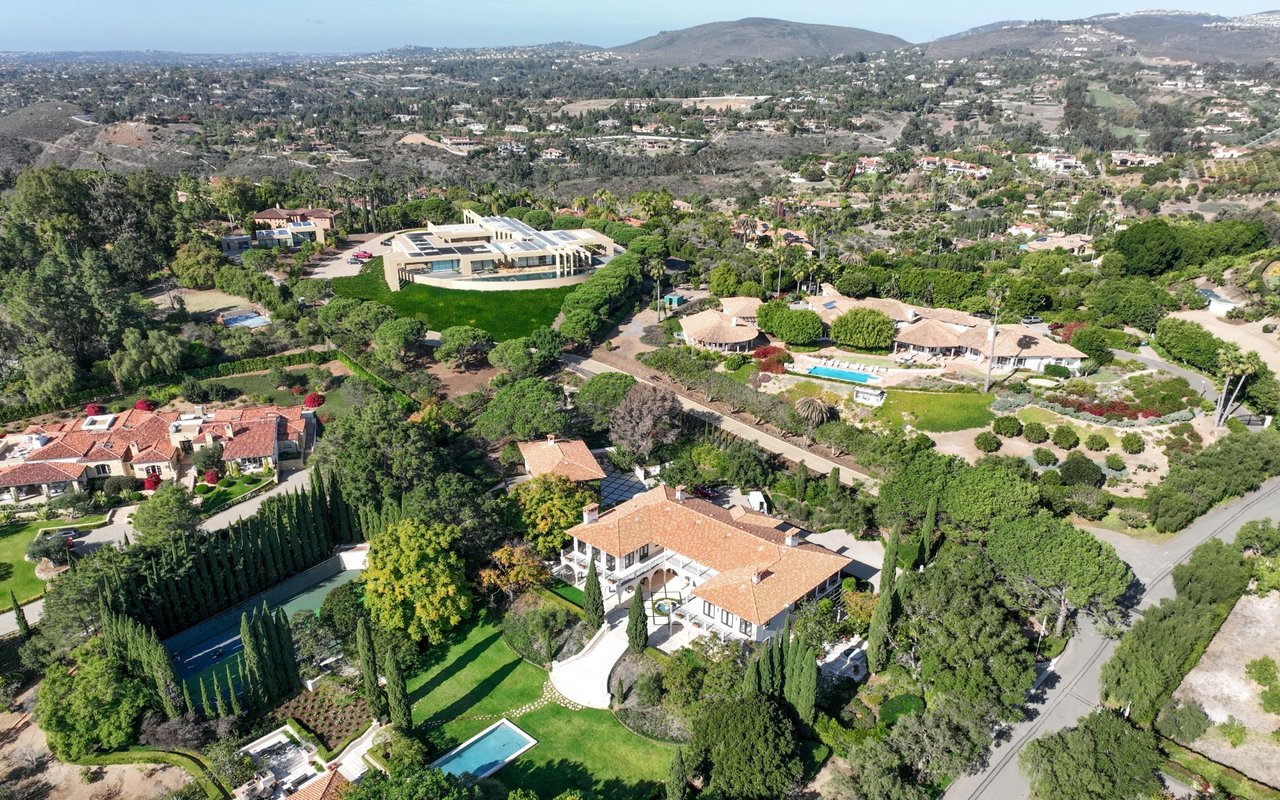
Explore the distinctive neighborhoods that make San Diego exceptional. From celebrated coastal communities to sought-after inland and urban areas, we help you find the lifestyle and the home that fits you best.
Our team is here to guide you every step of the way, making your real estate journey seamless, informed, and successful. Connect with us today.